

How To Create A Subset Of A Dataframe In R
What is a Data Frame?
A data frame is a list of vectors which are of equal length. A matrix contains only one type of data, while a data frame accepts different data types (numeric, character, factor, etc.).
In this tutorial, you will learn-
- What is a Data Frame?
- How to Create a Data Frame
- Append a Column to Data Frame
- Select a Column of a Data Frame
- Subset a Data Frame
How to Create a Data Frame
We can create a dataframe in R by passing the variable a,b,c,d into the data.frame() function. We can R create dataframe and name the columns with name() and simply specify the name of the variables.
data.frame(df, stringsAsFactors = TRUE)
Arguments:
- df: It can be a matrix to convert as a data frame or a collection of variables to join
- stringsAsFactors: Convert string to factor by default
We can create a dataframe in R for our first data set by combining four variables of same length.
# Create a, b, c, d variables a <- c(10,20,30,40) b <- c('book', 'pen', 'textbook', 'pencil_case') c <- c(TRUE,FALSE,TRUE,FALSE) d <- c(2.5, 8, 10, 7) # Join the variables to create a data frame df <- data.frame(a,b,c,d) df Output:
## a b c d ## 1 10 book TRUE 2.5 ## 2 20 pen FALSE 8.0 ## 3 30 textbook TRUE 10.0 ## 4 40 pencil_case FALSE 7.0
We can see the column headers have the same name as the variables. We can change column name in R with the function names(). Check the R create dataframe example below:
# Name the data frame names(df) <- c('ID', 'items', 'store', 'price') df Output:
## ID items store price ## 1 10 book TRUE 2.5 ## 2 20 pen FALSE 8.0 ## 3 30 textbook TRUE 10.0 ## 4 40 pencil_case FALSE 7.0
# Print the structure str(df)
Output:
## 'data.frame': 4 obs. of 4 variables: ## $ ID : num 10 20 30 40 ## $ items: Factor w/ 4 levels "book","pen","pencil_case",..: 1 2 4 3 ## $ store: logi TRUE FALSE TRUE FALSE ## $ price: num 2.5 8 10 7
By default, data frame returns string variables as a factor.
Slice Data Frame
It is possible to SLICE values of a Data Frame. We select the rows and columns to return into bracket precede by the name of the data frame.
A data frame is composed of rows and columns, df[A, B]. A represents the rows and B the columns. We can slice either by specifying the rows and/or columns.
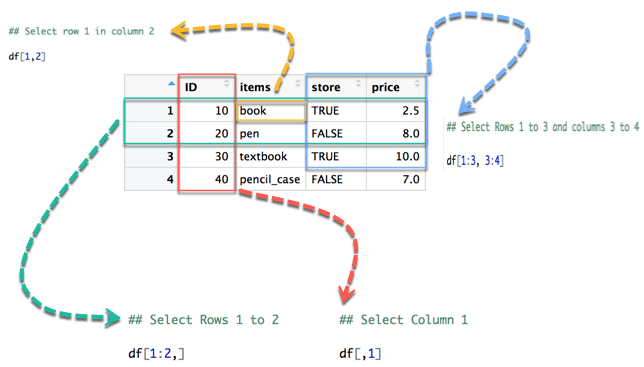
From picture 1, the left part represents the rows, and the right part is the columns. Note that the symbol : means to. For instance, 1:3 intends to select values from 1 to 3.

In below diagram we display how to access different selection of the data frame:
- The yellow arrow selects the row 1 in column 2
- The green arrow selects the rows 1 to 2
- The red arrow selects the column 1
- The blue arrow selects the rows 1 to 3 and columns 3 to 4
Note that, if we let the left part blank, R will select all the rows. By analogy, if we let the right part blank, R will select all the columns.
We can run the code in the console:
## Select row 1 in column 2 df[1,2]
Output:
## [1] book ## Levels: book pen pencil_case textbook
## Select Rows 1 to 2 df[1:2,]
Output:
## ID items store price ## 1 10 book TRUE 2.5 ## 2 20 pen FALSE 8.0
## Select Columns 1 df[,1]
Output:
## [1] 10 20 30 40
## Select Rows 1 to 3 and columns 3 to 4 df[1:3, 3:4]
Output:
## store price ## 1 TRUE 2.5 ## 2 FALSE 8.0 ## 3 TRUE 10.0
It is also possible to select the columns with their names. For instance, the code below extracts two columns: ID and store.
# Slice with columns name df[, c('ID', 'store')] Output:
## ID store ## 1 10 TRUE ## 2 20 FALSE ## 3 30 TRUE ## 4 40 FALSE
Append a Column to Data Frame
You can also append a column to a Data Frame. You need to use the symbol $ to append dataframe R variable and add a column to a dataframe in R.
# Create a new vector quantity <- c(10, 35, 40, 5) # Add `quantity` to the `df` data frame df$quantity <- quantity df
Output:
## ID items store price quantity ## 1 10 book TRUE 2.5 10 ## 2 20 pen FALSE 8.0 35 ## 3 30 textbook TRUE 10.0 40 ## 4 40 pencil_case FALSE 7.0 5
Note: The number of elements in the vector has to be equal to the no of elements in data frame. Executing the following statement to add column to dataframe R
quantity <- c(10, 35, 40) # Add `quantity` to the `df` data frame df$quantity <- quantity
Gives error:
Error in `$<-.data.frame`(`*tmp*`, quantity, value = c(10, 35, 40)) replacement has 3 rows, data has 4
Select a Column of a Data Frame
Sometimes, we need to store a column of a data frame for future use or perform operation on a column. We can use the $ sign to select the column from a data frame.
# Select the column ID df$ID
Output:
## [1] 1 2 3 4
Subset a Data Frame
In the previous section, we selected an entire column without condition. It is possible to subset based on whether or not a certain condition was true.
We use the subset() function.
subset(x, condition) arguments: - x: data frame used to perform the subset - condition: define the conditional statement
We want to return only the items with price above 10, we can do:
# Select price above 5 subset(df, subset = price > 5)
Output:
ID items store price 2 20 pen FALSE 8 3 30 textbook TRUE 10 4 40 pencil_case FALSE 7
How To Create A Subset Of A Dataframe In R
Source: https://www.guru99.com/r-data-frames.html
Posted by: jacobsfooster.blogspot.com
0 Response to "How To Create A Subset Of A Dataframe In R"
Post a Comment